Riley Beck · 26 October 2026
Mapping Regional Interaction Trends Through Location-Based Tagging in Online Community Platforms
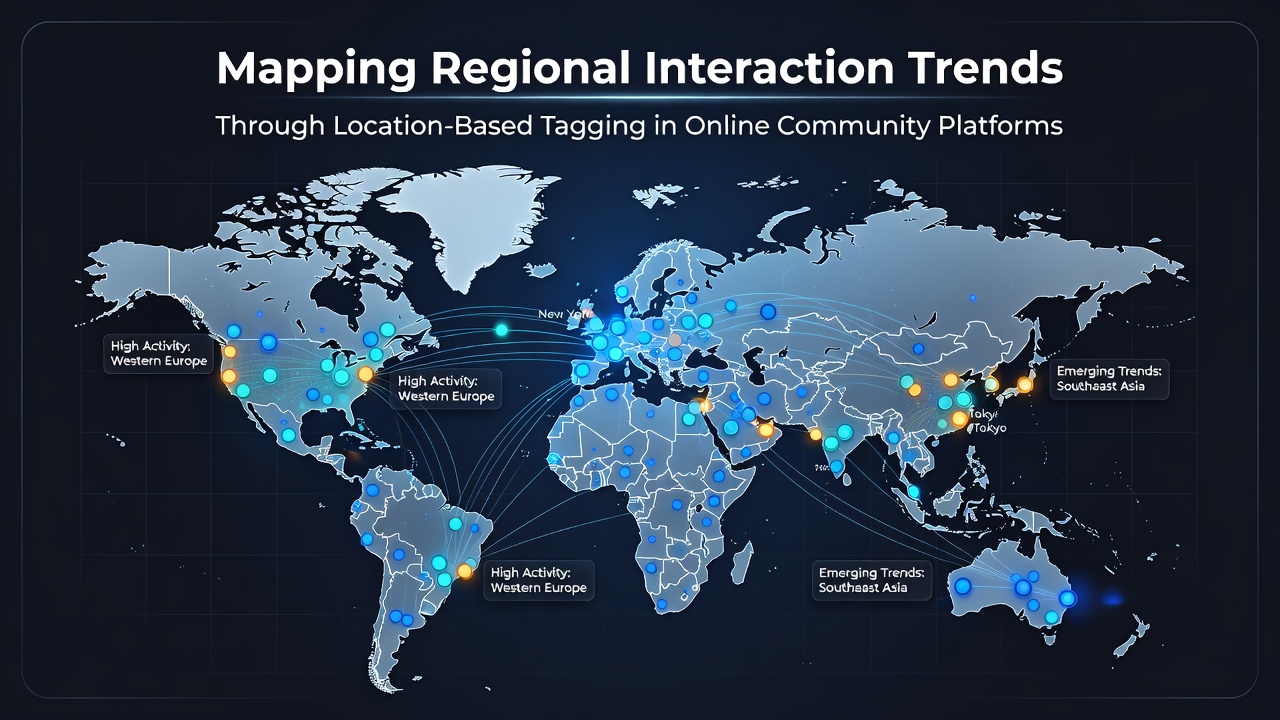
Online community platforms have incorporated location-based tagging systems that allow users to attach geographic data to posts, comments, and profiles, creating datasets that researchers use to track interaction patterns across cities, regions, and countries. These tags operate through GPS coordinates, user-selected places, or IP-derived locations, and they generate visible clusters of activity that reveal how people connect within and between specific areas. In October 2026, several major platforms updated their tagging APIs to include finer granularity for rural and suburban zones, which expanded the available data points for trend analysis.
How Location Tagging Generates Interaction Data
Platforms collect location tags when users opt in during posting or profile setup, and these entries feed into backend systems that aggregate anonymous metrics such as tag frequency, co-occurrence rates, and cross-region reply chains. Data shows that urban centers produce higher volumes of tags per capita while rural tags often link to broader metropolitan hubs through shared interest threads. Researchers have observed that the combination of timestamped tags with interaction logs produces heat maps that highlight peak activity periods tied to local events or time zones.
One study from academic institutions examined tag networks in North American platforms and found that tags referencing shared landmarks increased reply rates by measurable margins compared with generic topic posts. The same analysis revealed that users in adjacent provinces or states formed denser connection graphs when location tags overlapped on common geographic features like rivers or highways. Government statistical agencies in Canada have begun incorporating similar aggregated location datasets into public reports on digital engagement patterns.
Regional Patterns Observed Across Platforms
European platforms display distinct tagging behaviors where users in densely populated corridors such as the Rhine-Ruhr area generate frequent cross-border tags with neighboring countries. These tags often appear in discussions about transportation or environmental topics, and they correlate with higher volumes of multilingual replies. In contrast, platforms serving Asia-Pacific regions show stronger intra-country clustering, with tags concentrated around capital cities and coastal economic zones that draw interactions from inland provinces.
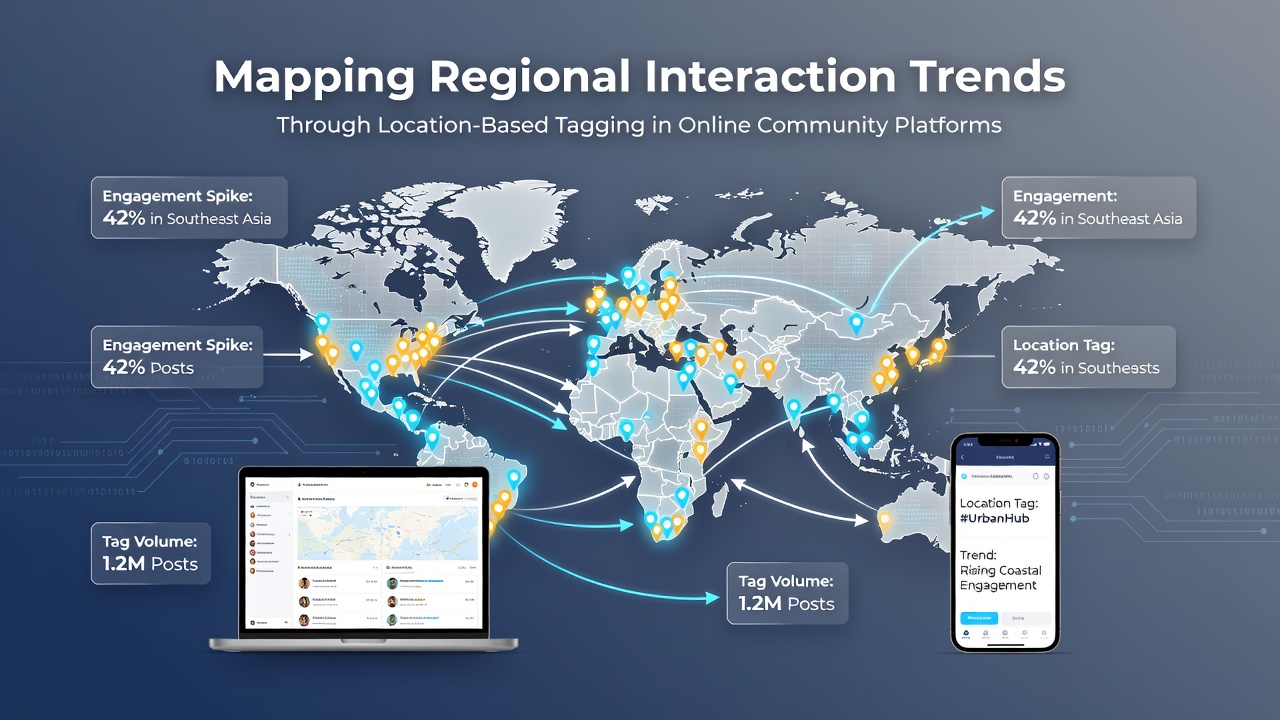
Australian digital forums demonstrate seasonal shifts in tagging activity, where tags referencing coastal regions spike during summer months and connect with users in inland territories through event-based threads. Data collected through October 2026 indicates that these seasonal patterns align with tourism statistics published by national agencies. Observers note that location tags in these forums frequently co-occur with hashtags for local festivals, creating traceable pathways that map temporary spikes in regional engagement.
Technical Mechanisms Behind Trend Mapping
Developers implement tagging through standardized metadata fields that platforms store alongside content identifiers, enabling queries that filter interactions by radius or administrative boundaries. Machine learning models then process these tagged datasets to identify recurring connection motifs, such as repeated tag pairs between specific city pairs or elevated activity along transportation corridors. Reports from industry research groups indicate that accuracy of location inference improves when platforms combine multiple signals including device sensors and user-confirmed places.
Analysts apply network analysis tools to the resulting graphs, measuring metrics like betweenness centrality to determine which tagged locations serve as bridges between otherwise separate communities. These calculations help identify emerging interaction corridors that may not appear in traditional demographic surveys. European Union digital policy documents reference similar analytical approaches when discussing platform data governance standards.
Applications in Research and Platform Development
Academic teams have used tagged interaction data to study how regional economic conditions influence online connection rates, finding correlations between tag density and local employment statistics in multiple countries. Platform operators apply the same datasets to adjust recommendation algorithms so that users see content from geographically relevant areas without explicit search terms. In October 2026 updates, several services introduced optional privacy controls that let users limit tag visibility to specific circles while still contributing anonymized data to aggregate trend reports.
Public health researchers have examined location-tagged discussions during regional events to track information spread patterns across affected zones. These studies rely on datasets released under open data initiatives by statistical offices in various nations, which provide standardized geographic coding that aligns with platform tag formats. The resulting maps allow comparisons of interaction speed between urban clusters and more dispersed regional networks.
Conclusion
Location-based tagging continues to supply structured geographic signals that researchers and platform developers convert into maps of regional interaction trends. Aggregated data from these systems reveals consistent patterns of urban-rural linkages, seasonal variations, and cross-border connections that align with independent statistical sources. As tagging features evolve through 2026 and beyond, the available datasets support increasingly detailed analyses of how online communities reflect and reinforce geographic relationships.