Casey Simon · 28 September 2026
How Visual Curation Shapes Discovery Patterns in Geography-Centric Online Networks
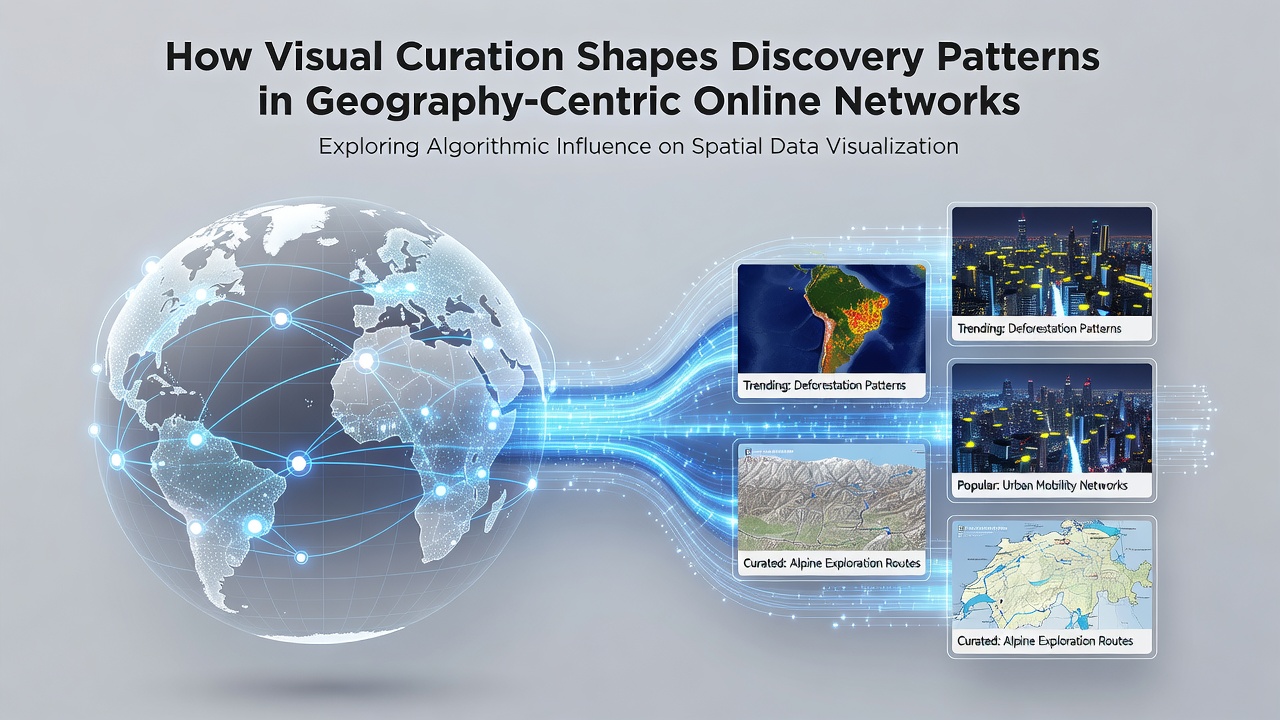
Geography-centric online networks rely on visual curation to organize images, maps, satellite views, and user-generated photos into structured collections that direct how participants locate and explore places, and this practice has grown alongside advances in geospatial tools since the early 2010s. Platforms that emphasize location data integrate visual selection processes where moderators or algorithms choose representative images, arrange them by theme or region, and surface them through feeds or search results. Observers note that these choices influence which areas receive attention because users encounter curated visuals first and often follow pathways suggested by the presentation order.
Core Mechanisms of Visual Curation in Location-Based Systems
Visual curation operates through tagging systems, thematic boards, and algorithmic ranking that prioritize high-resolution imagery and clear geographic markers, while users interact with these elements by saving, sharing, or commenting on specific items. Data from geospatial research indicates that networks incorporating strong visual layers see higher engagement with rural and urban sites alike when images highlight distinctive features such as topography, infrastructure, or seasonal changes. Researchers have documented that consistent application of color palettes and scale references in curated sets helps users compare distant locations without leaving the interface, which accelerates pattern recognition across multiple regions.
Algorithms within these networks analyze metadata from photos including GPS coordinates, timestamps, and user captions to refine recommendations, and this feedback loop strengthens as more participants contribute content. Studies conducted by academic groups show that visual prompts increase the likelihood of discovering lesser-known sites because the arrangement draws attention to overlooked coordinates rather than only popular destinations. Those who manage such platforms often apply editorial guidelines that balance commercial imagery with community submissions to maintain diversity in the visual record.
Influence on User Discovery Pathways
Discovery patterns shift when visual curation emphasizes certain geographic clusters, for instance grouping images of coastal zones together or sequencing mountain ranges by elevation data. This organization guides users toward sequential exploration that mirrors physical travel routes even though the activity occurs entirely online. Figures released by mapping agencies reveal that participants spend longer sessions when visuals include comparative overlays such as historical maps alongside current satellite views, because the contrast reveals change over time. Networks that update curated collections regularly maintain higher retention rates since fresh imagery signals ongoing relevance to specific locales.
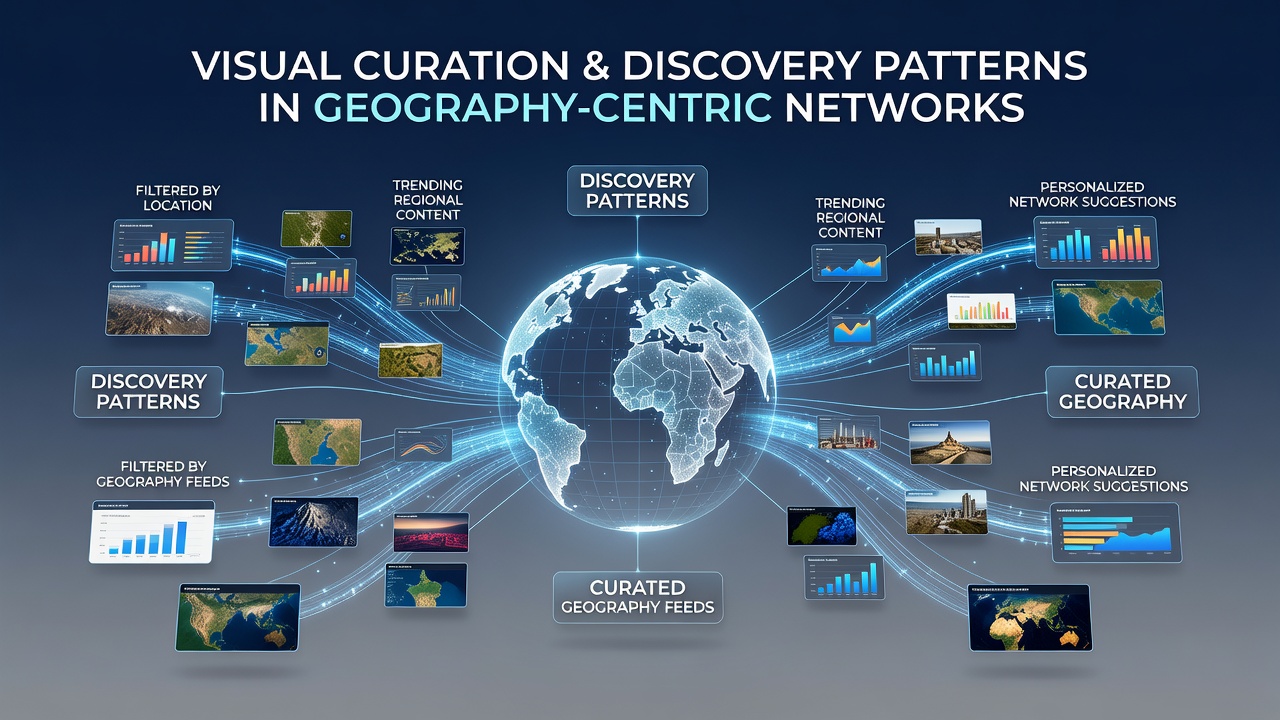
Users frequently begin searches through broad visual categories before narrowing to precise coordinates, and this funnel effect concentrates attention on areas featured prominently in the initial displays. Research from institutions tracking digital behavior finds that visual emphasis on accessibility features, such as trails or transit links, correlates with increased queries about those exact locations in subsequent weeks. The process creates self-reinforcing loops where popular visuals attract more contributions, further shaping which regions appear discoverable to new arrivals on the platform.
Data Trends Observed Through 2026
By September 2026, usage metrics across major geography-centric networks showed continued growth in visual search volume, with platforms reporting that over 60 percent of location discoveries originated from curated image sets rather than text-based queries. Reports compiled by the U.S. Geological Survey highlight how integration of high-resolution visual layers has expanded the range of documented sites, particularly in regions previously underrepresented in public datasets. European geospatial agencies have recorded similar patterns where visual curation supports cross-border comparisons that aid researchers studying environmental shifts.
Industry analyses from the Geoscience Australia indicate that networks incorporating user-moderated visual collections experience faster updates to geographic records because contributors respond directly to displayed imagery. These updates improve accuracy for transient features such as construction zones or seasonal water levels, which in turn refines discovery accuracy for subsequent users. Observers tracking platform activity note that September 2026 data sets demonstrate measurable increases in queries originating from mobile devices, where visual thumbnails serve as primary entry points.
Conclusion
Visual curation continues to define how geography-centric online networks channel user attention toward specific locations through deliberate image selection and arrangement. The resulting discovery patterns reflect both platform design choices and collective user contributions, with measurable effects on which sites receive sustained attention. Ongoing data collection by government mapping bodies and research organizations provides the basis for understanding these dynamics as networks evolve.